Code Notebook
Python
Cell #1import pandas as pd
import numpy as np
import matplotlib as plt
Python
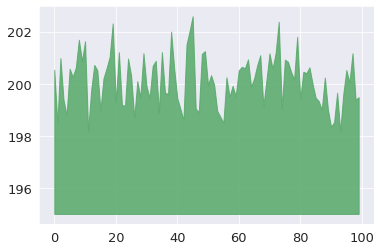
Cell #2ys = 200 + np.random.randn(100)
Python
Cell #3x = [x for x in range(len(ys))]
Python
Cell #4plt.plot(x, ys, '-')
plt.fill_between(x, ys, 195, where=(ys > 195), facecolor='g', alpha=0.6)
plt.title("Sample Visualization")
plt.show()
Python
Cell #6print(Hello World)
print(Hello World)
^
SyntaxError: invalid syntax